PASSENGERS' TRANSPORT INDUSTRY * Canada & USA - Time-Based Versus Distance-Based Fares
What are the options with payment schemes for public transportation? ...

(An image of Paris',France, transit map)
Washington,DC,USA -The CityFix, by Jonna McKone -October 22, 2010: ... There are two tiers of strategies that a Los Angeles Metro study recently outlined... Time-based systems allow passengers to ride a transit system and make free transfers for a set amount of time. This scheme can be anything from an unlimited weekly pass to an unlimited monthly pass, to even shorter periods of time, such as a free transfer within a one- to two-hour time period. This pricing system requires some sort of card (paper, magnetic or smart card) to issue the transfer... Distance-based systems charge higher fares for rides that cover greater distances. The fares could either be on a route-by-route basis, as we have in Washington, D.C., where the price between two points varies (here’s a nice run-down of the District’s pricing options), or a set of fare zones that could establish incremental fares based on certain regions of the city. For example, Paris has concentric circles that ring the city and form zone boundaries. Travel to the outer zones is more expensive than inner areas. Los Angeles’ Metrolink is much different—the system offers a daily pass for $6 and a preboard flat fare. The thought behind the distance-based scheme is that riders who use more service should pay for the service... There are drawbacks to both systems. Distance-based fares often end up being more complicated to develop and enforce, as they require a card to be re- swiped, tapped or punched for bus or rail, or they require a barrier that reinforces additional payment... The Los Angeles Metro system reviewed the pricing strategies of 244 North American transit services from data collected by the American Public Transportation Association (APTA). According to the findings, “some form of time-based pricing is offered on 32 of 244 systems with the most common form allowing unlimited transfers within the available time window (19 properties allow transfers within a 1 to 2 hour window)” ... For distance-based pricing, the report finds that this practice is uncommon for non-express routes and rail and more common for express routes and systems that radiate from a central area. LA Metro further analyzed distance-based systems and made a few interesting points. Time-based services incentivize the use of the fastest possible transit service, which often “are the most efficient for the transit provider to operate,” says the report. This means the rider can use as many services as possible within the window of time that the fare card allots. However, this type of fare scheme often leads to a higher base fare than the lowest pay-per-distance option (i.e. the shortest distance) ... And distance-based fares, as we said above, generally don’t occur for services like local buses and could encourage the use of cheaper, slower parallel services, which means a service provider is operating duplicate services. But in the case where distance-based fare is used for buses (examples include BRT systems in Ahmedabad and Bangkok), it can slow down service, as customers swipe in and out. Plus, this fare scheme can be particularly cumbersome for low-income users... What do you think? Which system works in your city?...* BC / Canada - Greyhound cut routes without licence approval - Bus line is in a squabble with B.C. Ferries over terminal access

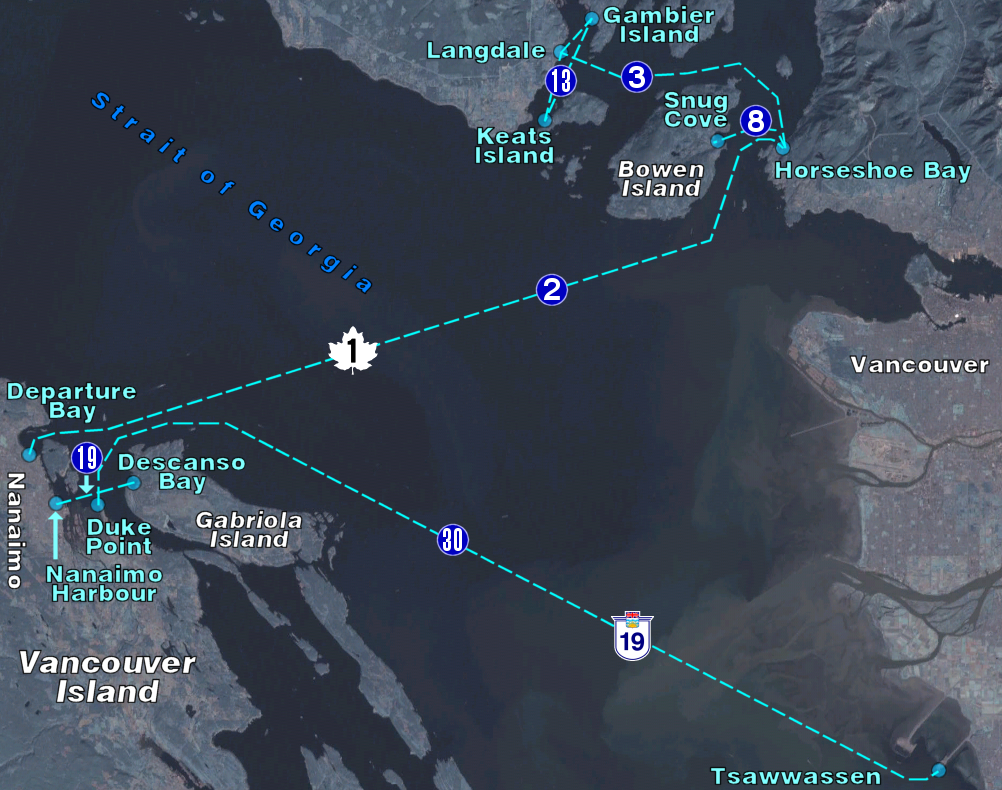
Vancouver,BC,Canada -Canada.com/Daily News, by Walter Cordery -October 15, 2010: -- Greyhound Canada may have jumped the gun when it cut back service, to just two buses daily, on the B.C. Ferries route from Nanaimo to Horseshoe Bay... The company actually reduced the number of sailings its buses would travel on effective Oct. 5... Jan Broocke, a director and secretary to B.C.'s Passenger Transportation Board, said the licence the bus carrier is currently operating under "requires Greyhound to make six trips daily from Nanaimo to Vancouver"... Tobin Robbins, a lawyer with Heenan Blaikie, told the Daily News that because of a financial dispute, B.C. Ferries erected a barricade to keep Greyhound buses out of Departure Bay... Greyhound, he said, was trying to minimize costs by offering a dropoff and pickup service that would have seen passengers dropped off at the terminal and then picked up by another bus in Horseshoe Bay six times a day...

* USA / NYC’s Lowest-Paid Workers Have Longest Commutes

(Map via Pratt Center)
New York,NY,USA -The CityFix, by: Jonna McKone -October 22, 2010: -- The Pratt Center published a series of maps that show commuting patterns of some 289,000 residents of 13 predominantly low- and moderate-income communities in New York City... The combined cost of housing and transportation burden is significant depending on where you live. Many Americans and people all over the world struggle with an enduring trade off: spending a greater share of income on housing for a shorter commute, or spending less of their income on housing in exchange for longer commutes and increased transportation costs. In 2007, The Center for Housing released a report called, “A Heavy Load: The Combined Housing and Transportation Burdens of Working Families” ... (You can download the full report here) ... The study of 28 metropolitan areas in the U.S. found that working families spend 57 percent of their income on the combined costs of housing and transportation. On average, transportation accounts for 29 percent of their income. The findings were similar across major cities from Denver to Baltimore to Honolulu...Labels: passengers' transport industry
posted by Unknown @ 10:07 AM
![]()
![]()


0 Comments:
Post a Comment
Subscribe to Post Comments [Atom]
<< Home